Infrastructure monitoring
Sheet 02
Real-timevisibility acrossevery system.
Continuous monitoring turns invisible infrastructure into a measurable, manageable asset class — read off the plant, not off a clipboard.
0 s
Between readings, per point
0
System families
0
Metrics tracked
24/7
Thresholds watching
Monitored families — 06
Every system,reporting now.
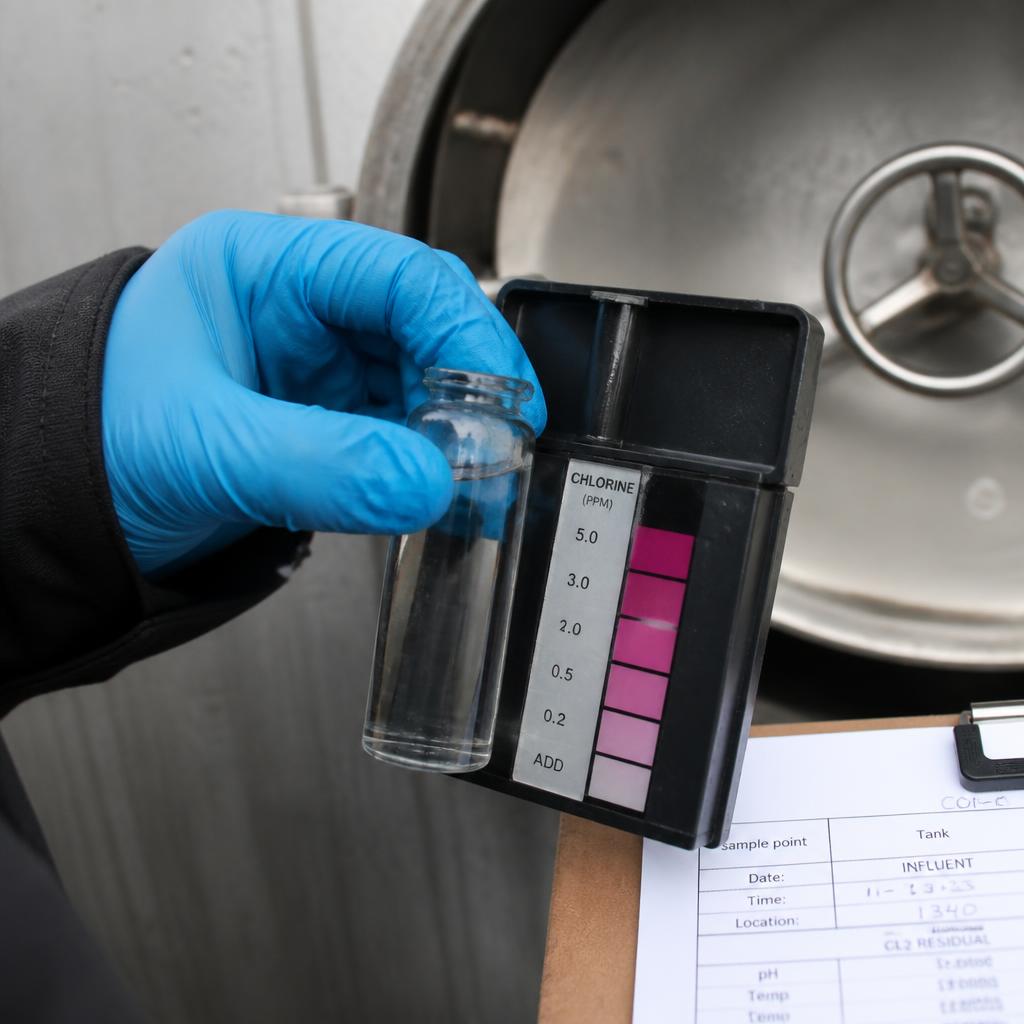
01 · Water systemsLive
pH · Tank 2
7.44▼
pHTurbidityChlorineTDSFlowPressure
02 · HVAC systemsLive
Supply air · AHU-03
22.2°C▼
TemperatureHumidityAir qualityRuntimeFilterEnergy
03 · Pumps & filtrationLive
Discharge pressure
4.19bar▼
PressureVibrationHours runFilter %Throughput
04 · ElectricalLive
Board load
41.1kW▼
VoltageLoadFault detectionDistribution
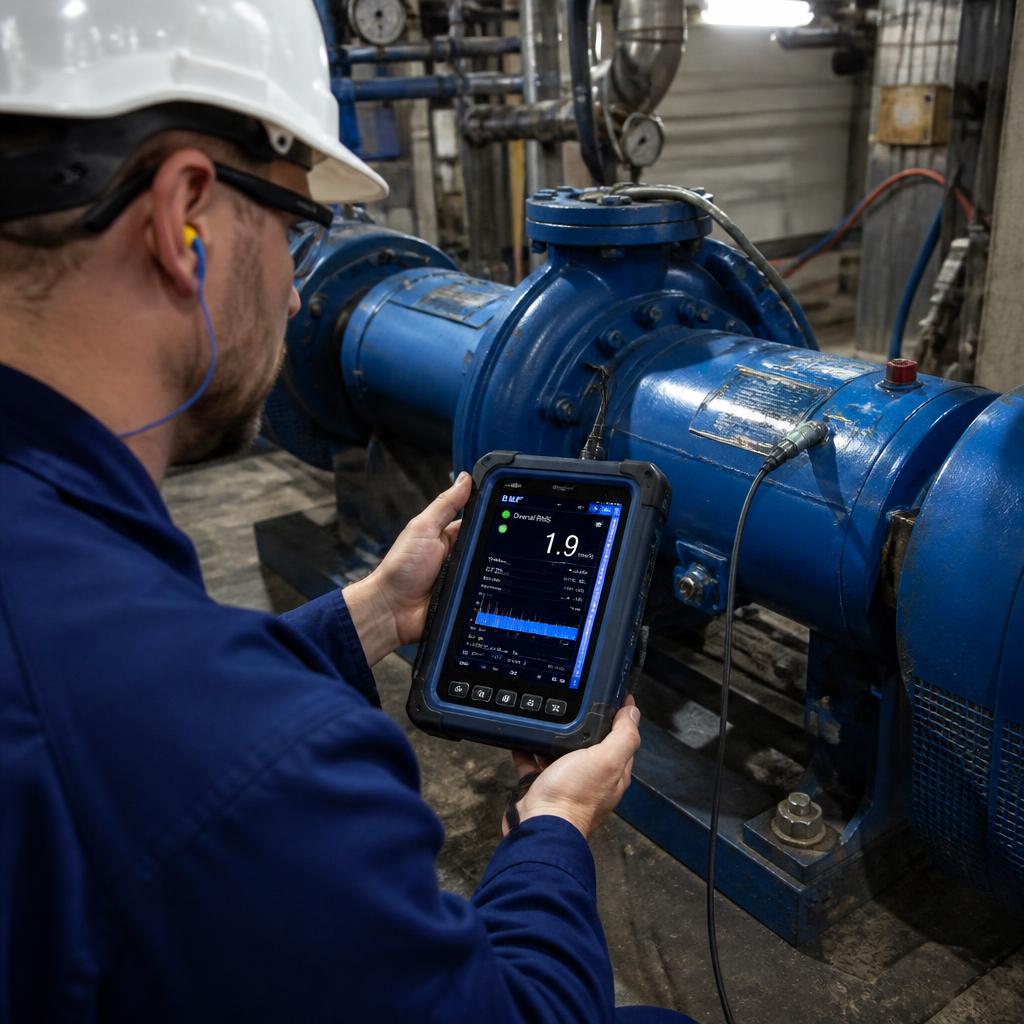
05 · MechanicalLive
Bearing vibration
2.11mm/s▼
Bearing tempVibrationLifecycleService interval
06 · ComplianceAudit log
Service log signed
Pump replacement · Palm Residences
Report generated
Water quality · Q3
Certificate filed
Backflow test · Harbour Point
Threshold changed
Chlorine lower limit · 0.50 mg/L
Thresholds
Thresholds do
the watching.
Every point carries its own limits. A reading outside them raises an alert the moment it happens, with the reading that caused it attached.
Chlorine residual · Tank 2 · 24h
Alert raised · 14:20:06
Chlorine below threshold — 0.46 mg/L
Work order WO-2291
Engineer assigned · on site 16:00
Read continuously
- pH
- Turbidity
- Chlorine
- Supply air
- Humidity
- Air quality
- Pressure
- Vibration
- Board load
- Runtime
The next step
See it readingyour building.
Connect a first site yourself, or have us wire up a sample of your plant and show you the numbers coming off it.